New York City Textile Repair Map

NYSP2I partnered with Hyloh to learn more about how New York City residents might—or might not—go about repairing a piece of clothing or an accessory. The results from the study were used to create a map for visualizing possible journeys a person with a broken item might take.

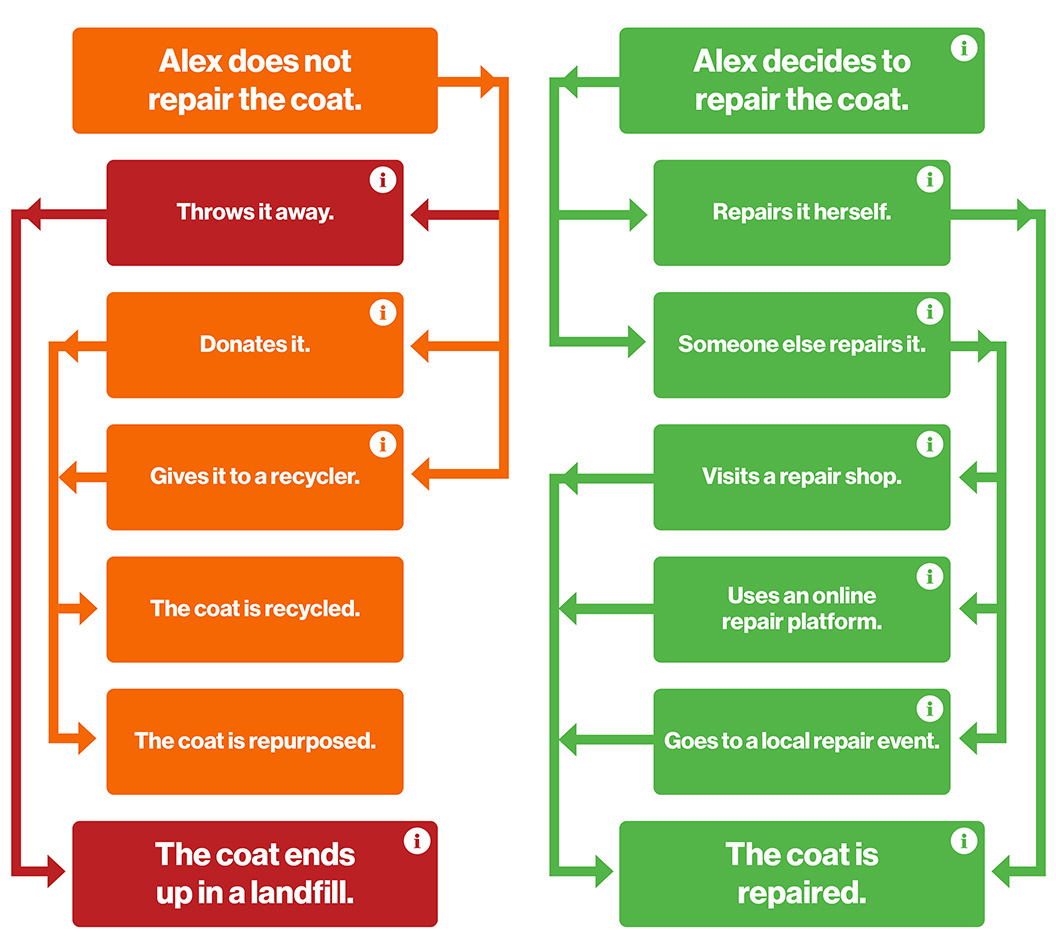
The zipper on Alex’s coat is broken.

Will Alex fix her coat or will it end up in a landfill?

See what happens when Alex, who lives in New York City, makes different decisions about the broken zipper on her coat.The visualization map below includes insights discovered during a 2023 research study conducted by NYSP2I and Hyloh. The study aimed to better understand the barriers to textile repair facing New York City residents in order to expand access to repair services and knowledge.
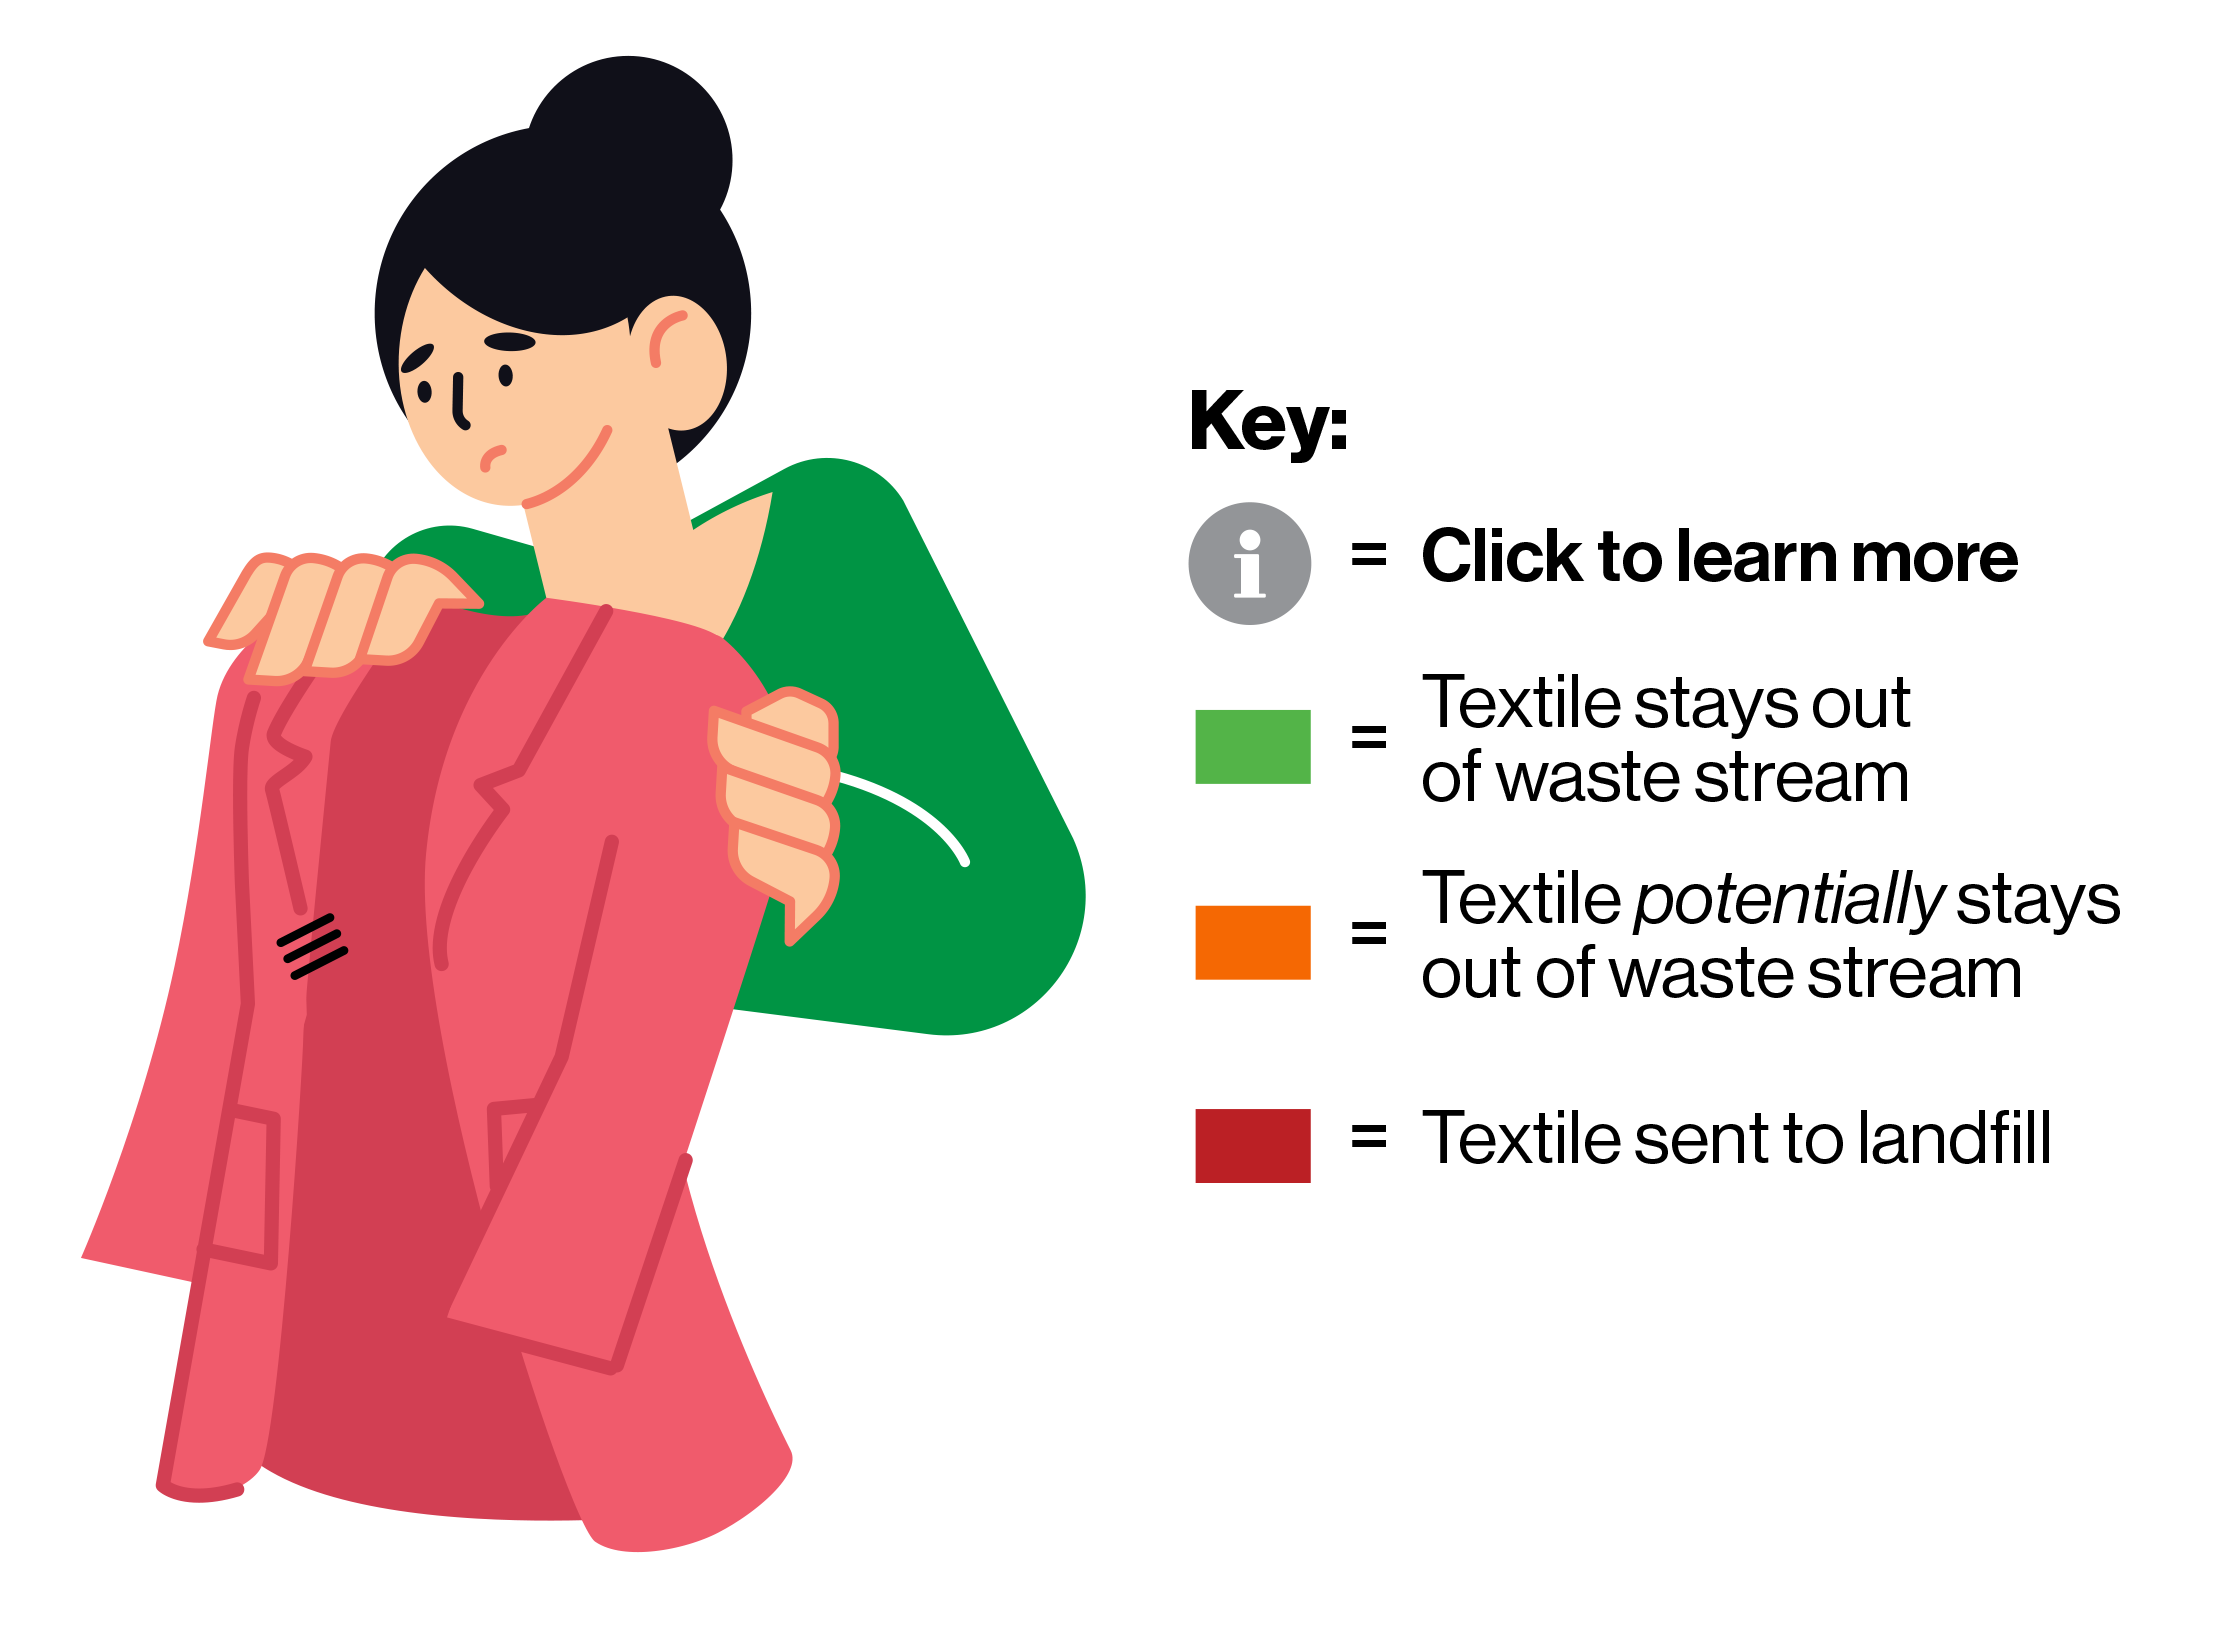
A drawing of a woman holding a shirt. The text next to her says: Key: i - click to learn more, green - textile stays out of waste stream, orange - textile potentially stays out of waste stream, red - textile sent to landfill.

What will Alex do? Click the cards below to learn more.

temp
temp mobile

1 2 3 4 5 6 7 8 9 10 111 2 3 4 5 6 7 8 9 10 11

About the Study

In this research study, the New York State Pollution Prevention Institute (NYSP2I) and Hyloh partnered to create a detailed and digestible systems map of how textile repair exists in New York City. This map serves as a valuable resource, highlighting existing repair routes that residents of New York City take when handling their broken and damaged garments and accessories. By analyzing data collected from key industry stakeholders and residents of New York City, the project identified voids in the current textile-repair landscape and opportunities for expansion and improvement. This systems map is intended as a comprehensive resource for residents and textile-repairers in New York City so they can understand the complexity of the issue and make informed decisions to help counter textile waste.

To develop this visualization map, NYSP2I and Hyloh conducted interviews with different key stakeholders, surveyed New York City residents that actively participate in reuse and repair, and collected data on informal reuse and repair outlets that exist in New York City.

Research Exclusions + Explanations

  • Upcycling: In this research study, we are only including upcycling as it pertains to worn garments (including textile-based accessories and shoes).
    • Examples of qualifying upcycling activities include taking apart two ripped jackets and making them into one, extensive patchwork, or using a t-shirt as the lining of a jacket.
    • Examples of exclusions include taking used t-shirts and making them into a quilt or using denim scraps to make upholstered furniture.
  • Brands: For the purpose of this research study, we are not including clothing brands in the key stakeholders list, nor are we fully mapping out their participation in the visualization map.
  • Textile-waste reduction hierarchy:
    • reuse
    • repair
    • recycle

Who we interviewed:
Hyloh conducted 12 interviews with key stakeholders within the textile repair community of New York City. Below is the breakdown of the stakeholders represented by organization type.

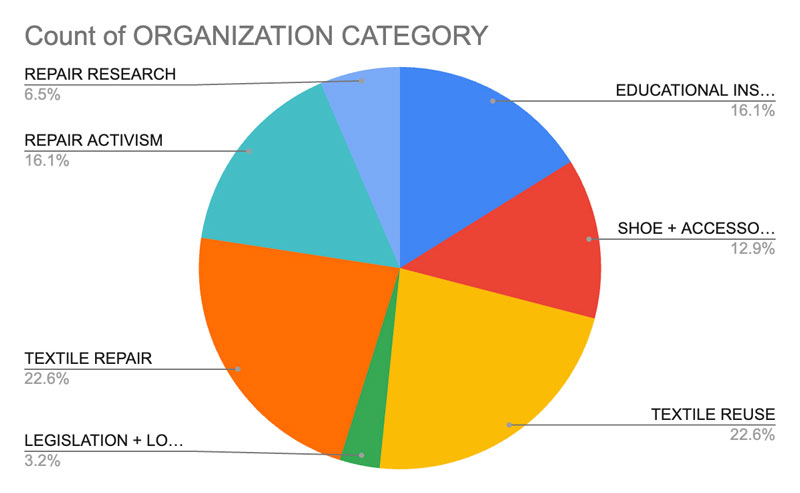
colorful pie graph with organization category percentages: Repair research: 6.5%, Repair activism: 16.1%, Textile repair: 22.6%, Legislation and local government : 3.2%, Educational instruction: 16.1%, Shoe and accessory repair: 12.9%, Textile reuse: 22.6%

The following is a breakdown of the categories that the stakeholder organizations represented.

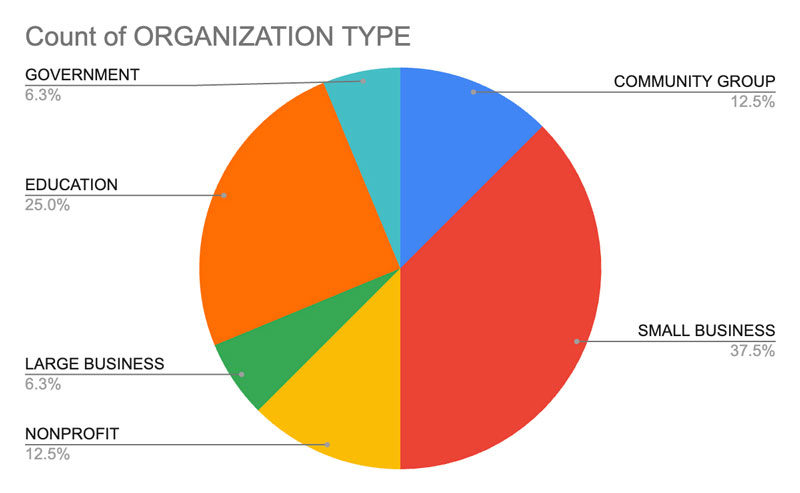
colorful pie graph with organization type percentages: Government: 6.3% , Education: 25% , Large business: 6.3% , Nonprofit: 12.5% , Community group: 12.5% , Small business: 37.5%

Who we surveyed:
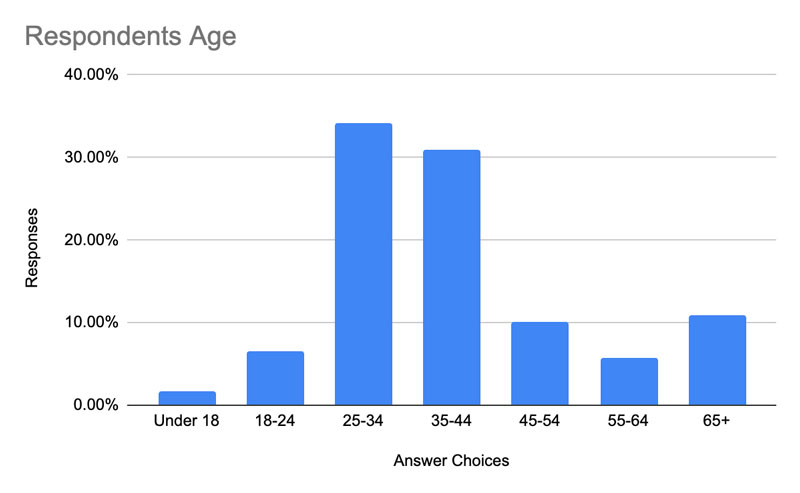
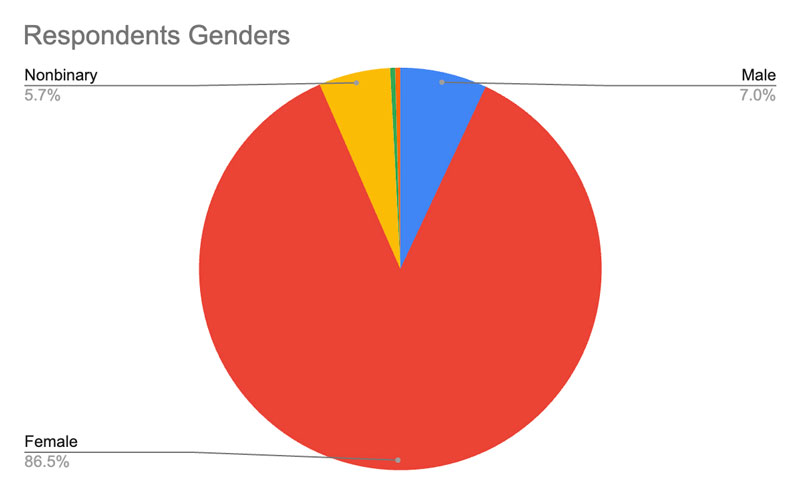
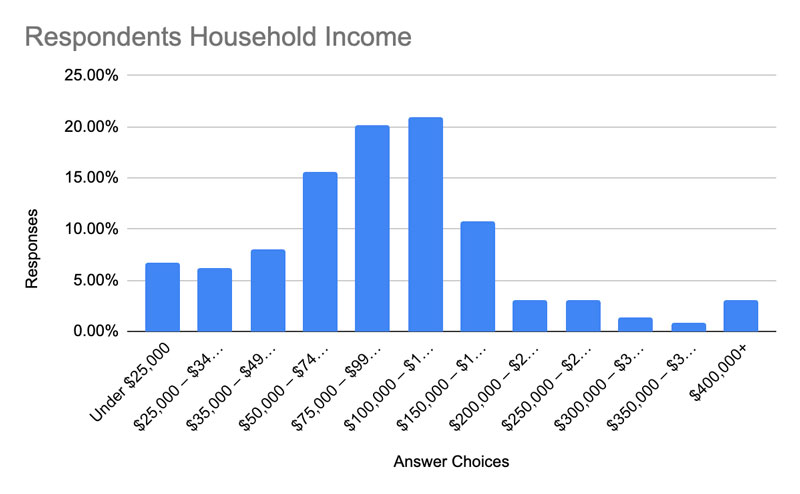
Hyloh distributed a survey of 15 questions to residents of New York City, targeting individuals that actively participate in reuse and repair. The survey was made available in both English and Spanish. A total of 247 valid responses were collected. The following is a brief overview of the demographics of the respondents.

bar graph of respondent ages: Under 18: 1.5%, 18 - 24: 6.5%, 25 - 34: 34%, 35 - 44: 31%, 45 - 54: 10%, 55 - 64: 6%, 65+: 11%

colorful pie graph with respondent genders: Nonbinary: 5.7%, Female: 86.5%, Male: 7%

bar graph of respondent household incomes: Under $25,000: 7%, $25,000 – $34,999: 6%, $35,000 – $49,999: 8%, $50,000 – $74,999: 16%, $75,000 – $99,999: 20%, $100,000 – $149,999: 21%, $150,000 – $199,999: 11 %, $200,0 00 – $249,999: 3%, $250,000 – $299,999: 3%, $300,000 – $349,999: 1%, $350,000 – $399,999: 1%, $400,000+: 3%

  • Informal repair and reuse: Organizations without well-established entities running them, such as neighborhood clothing swaps or repair cafés.
  • Formal repair: Repair businesses either with a brick-and-mortar or searchable virtual storefront.
  • Formal reuse: Established organizations with systematic approaches to incoming and outgoing donation management.
  • Textile repair: Fixing, mending, or altering an item to a usable condition. It includes worn garments, textile-based accessories (e.g., bags, scarves, hats, etc.), and shoes. It does not include upholstery, linens, and other household textiles. There are invisible and visible types of textile repair. Examples of invisible repair include fixing or mending an item to a usable condition without noticeably seeing the repairs (e.g., sewing a button on a shirt, mending a seam on a skirt). Visible repair means fixing or mending an item to a usable condition with noticeable signs of repair, u changing how its original appearance (e.g., darning a sweater with an embroidered design, using a decorative patch to fix a jacket’s elbow tear, dying a t-shirt to hide stains).
  • Repurpose: To use an otherwise unwanted textile item for a different purpose, such as using a ripped or torn clothing item as a wipe for cleaning. The specific end use of a repurposed textile—whether it is reused as is, repurposed, or recycled—is often unknown to the person dropping the article off.

While developing the visualization map, we identified the following opportunities for continued research: 

  • Brand perspective: This visualization map seeks to understand the perspectives of textile repair among both New York City residents and local repair businesses. Our next step will be to understand how clothing brands engage in repair. As the producers of the products that consumers are purchasing, wearing, reselling, repairing, and discarding, their voice in clothing repair is crucial.
  • Repair audit: You can’t manage what you don’t measure. In order to fully understand the levels of garment repairability that donation centers and textile sorters are receiving, we need to perform an audit.  Data indicating the types of repairs that garments require when people drop them off for donation will allow us to act on some of the opportunities outlined in this research.
  • Product returns: Further understanding of the complexity of product returns from the viewpoint of retailers, as well as consumer habits, is necessary in order to continue to grow the textile repair sector of New York City and beyond. Product returns are often a thorn in retailer’s businesses, but it is a service that consumers have come to expect. As clothing consumption has increased, so has the barriers retailers face when it comes to absorbing returns back into inventory. A better understanding of the returns system will allow for a deeper grasp of how repair could decrease textile waste.
  • Technology: Repair is a very manual, laborious process, both in terms of mending garments and assessing their condition. In our research, repair businesses mentioned that finding high-quality labor to perform textile repairs could often be the most difficult piece of running a repair shop. Dedicated research into potential technological tools that could help streamline repairs may prove to be valuable to furthering textile repair and reducing textile waste.
  • New York City residents can search for local clothing and textile drop-off locations at nyc.gov/donate.
  • New York City residents can search for local clothing and textile recycling drop-off locations at nyc.gov/textiles.

Watch the webinar! Finding a Common Thread: Visualizing Textile Repair in NYC

The New York State Pollution Prevention Institute partnered with Hyloh in a research study to learn more about how New York City residents might—or might not—go about repairing a piece of clothing or an accessory. The results from the study were used to create a visual of the journey a person with a broken item might take. By analyzing data collected from key industry stakeholders and residents of New York City, the project identified voids in the current textile-repair landscape and opportunities for expansion and improvement.

Learn more about our project partner, Hyloh

© 2024 Rochester Institute of Technology. Funding provided by the Environmental Protection Fund as administered by the New York State Department of Environmental Conservation. Any opinions, findings, and/or interpretations of data contained herein are the responsibility of Rochester Institute of Technology and its New York State Pollution Prevention Institute and do not necessarily represent the opinions, interpretations or policy of the State.

nyc skyline illustration